

- /
Is Cape Coral a Buyer's or Seller's Market Right Now? (October 2026 Update)
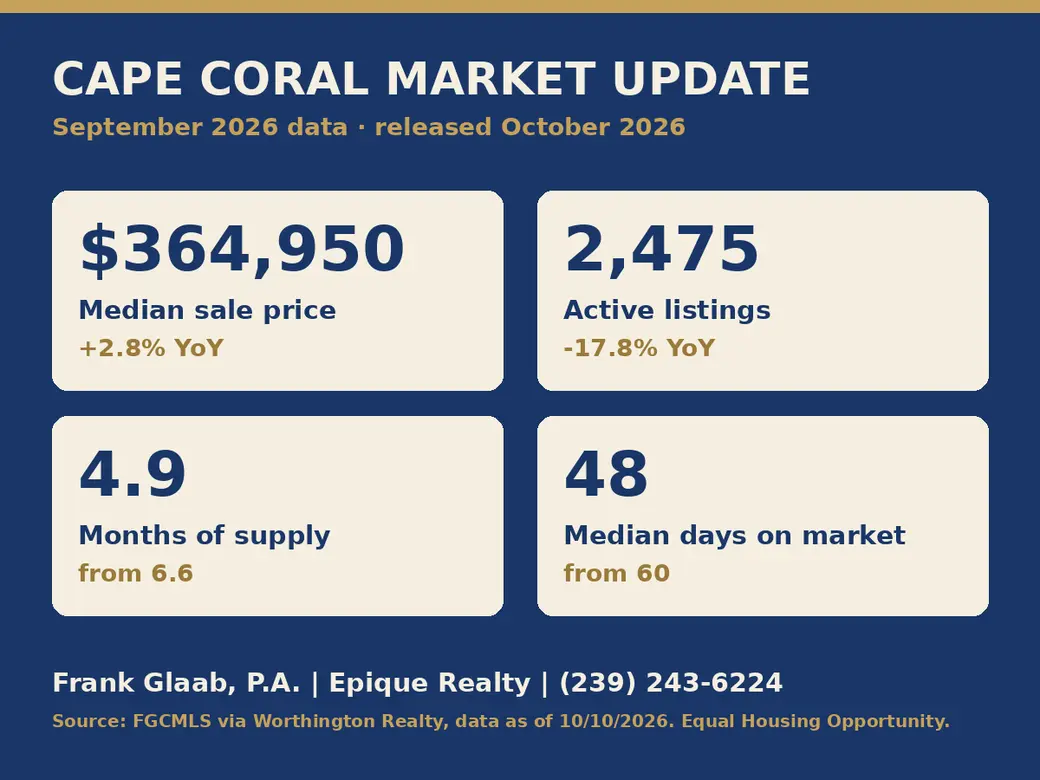
Short answer: Cape Coral is still a fairly balanced market that leans slightly toward buyers, but it is tighter than it was a year ago. In September 2026 the city had about 4.9 months of supply, down from 6.6 a year earlier. Active listings were down 17.8%, and the median sale price was up 2.8% year over year. Buyers still have room to negotiate. Sellers who price well are seeing quicker sales.
The September 2026 numbers were released in mid-October. Here is what they mean if you plan to buy or sell in Cape Coral this fall.
The Cape Coral numbers at a glance (September 2026)
These are figures for all home types in Cape Coral from the Florida Gulf Coast MLS, as reported by Worthington Realty (data as of October 10, 2026):
| Measure | September 2026 | Change vs. Sept. 2025 |
|---|---|---|
| Median sale price | $364,950 | +2.8% |
| Single-family median | $380,000 | +4.1% |
| Closed sales | 438 | −2.7% |
| Pending sales | 465 | +3.3% |
| Active listings | 2,475 | −17.8% |
| Months of supply | 4.9 | down from 6.6 |
| Median days on market | 48 | down from 60 |
| Price per sq. ft. | $212 | −1.4% |
| Sold-to-list ratio | 97.4% | +0.1 pts |
For Lee County as a whole, Florida Realtors® reported 1,116 single-family sales in the Cape Coral–Fort Myers metro area in September 2026, up 0.3% from a year earlier. The median single-family price was $375,500, up 0.1%. FGCU's Regional Economic Research Institute summarized the same data on October 16, 2026.
What's driving the Cape Coral market
Fewer homes for sale. Active listings have been lower than the year before for seven months in a row. This matters more than anything else in the report. With fewer choices, buyers who are ready to move are competing for a smaller pool of homes. That helps explain why days on market fell from 60 to 48.
More buyer activity. Pending contracts were up 3.3% from a year earlier. Worthington's separate September showings report found Cape Coral listings averaged 4.4 showings each. That was up 25.7% year over year and the highest for any September since 2022.
Prices are firm but not running away. The median price has been above the prior year for five straight months, May through September. Price per square foot slipped 1.4%, though. More large homes closing in a month can push the median up even when price per square foot doesn't rise. So be careful about calling this a price boom.
What this means if you're buying in Cape Coral
- You can still negotiate. Homes are selling for about 97.4% of asking price on average. That usually leaves room on price, repairs or seller credits, especially on homes that have sat on the market.
- Good homes move faster. With a 48-day median and fewer listings, a well-priced home with a newer roof, a sound seawall or a good insurance profile may not last long.
- Do your homework on each property. In Cape Coral, the flood zone, elevation certificate, seawall condition, roof age and insurance quote can change your monthly cost as much as the price does. Get insurance quotes and inspections early in the process.
Ready to look? Browse current Cape Coral homes for sale, or set up a saved search so new listings come to you first.
What this means if you're selling in Cape Coral
- Less competition works in your favor. About 18% fewer competing listings than last year means your home stands out more.
- Pricing still decides the outcome. Price per square foot dipped year over year, and a 20.9% re-list rate shows many sellers have had to take their homes off the market and try again. Starting at the right price usually beats cutting the price later.
- Prepare for informed buyers. Have your roof, seawall, wind-mitigation and flood information ready. That cuts down on renegotiation after the inspection.
Curious what your home could sell for in today's market? Request a free, no-obligation home value evaluation.
The bottom line
Cape Coral in fall 2026 isn't the frenzy of 2021–2022, and it isn't the slow market of 2025 either. Inventory is shrinking and buyer activity is rising, while prices are holding steady with modest gains. For buyers, this is a window to negotiate before supply tightens further. For sellers, it's a better setup than a year ago, as long as the price is right.
Every neighborhood and price range behaves a little differently, from Southwest Cape gulf-access canals to Northwest Cape new construction. If you'd like numbers for your street or the area you're targeting, I'm happy to pull them for you.
Frank Glaab, P.A. Broker Associate, Epique Realty 📞 (239) 243-6224 | ✉️ frank@movecapecoral.com movecapecoral.com
Sources: Worthington Realty Cape Coral market data (FGCMLS via Stellar MLS, data as of Oct. 10, 2026); Worthington Realty Cape Coral Showings September 2026 report; Florida Realtors® September 2026 MSA Single-Family Summary; FGCU Regional Economic Research Institute (updated Oct. 16, 2026). Statistics are deemed reliable but not guaranteed and may be revised. Epique Realty and Frank Glaab, P.A. support the Fair Housing Act and equal opportunity housing.
Categories
Recent Posts


Epique Realty
Phone